E4S
Doppler Pendulum Project
Material for a UC Irvine course offered by the Department of Physics Astronomy and developed by David Kirkby.
Introduction
The goal of this activity is to perform a novel physics experiment using components in your kit together with a new module called a PSoC6 Evaluation Kit that is significantly more powerful than a PicoW and which includes many of the same sensors in your kit.
The goal of the experiment is to study:
- the acceleration experienced by a swinging pendulum bob
- the Doppler shift of a stationary tone generator observed by a swinging pendulum bob
Equipment
Each numbered bag contains:
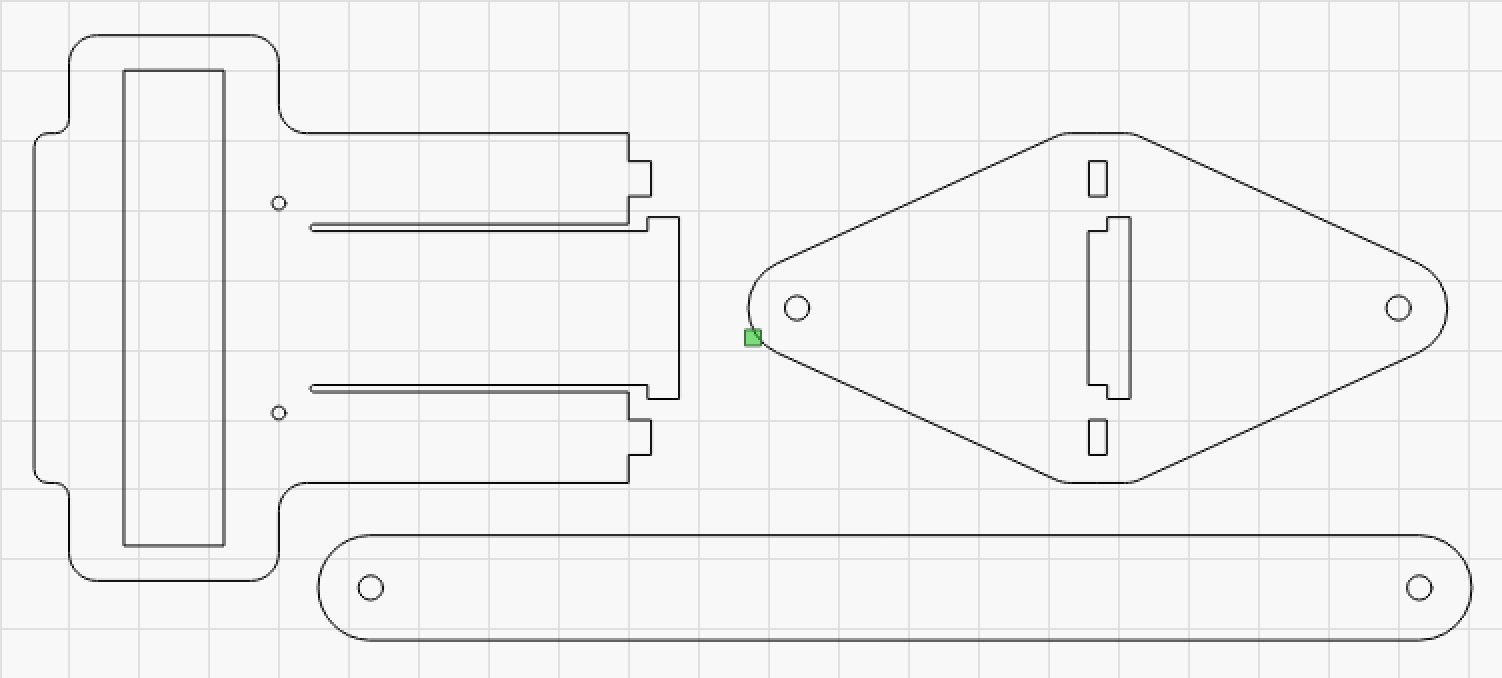
- pendulum fixture made of 3 laser-cut plastic parts
- 3.7V LiPo rechargeable battery, connected to the plastic parts with 2 rubber bands
- PSoC6 evaluation kit
- string looped through the plastic parts and bundled up with a rubber band
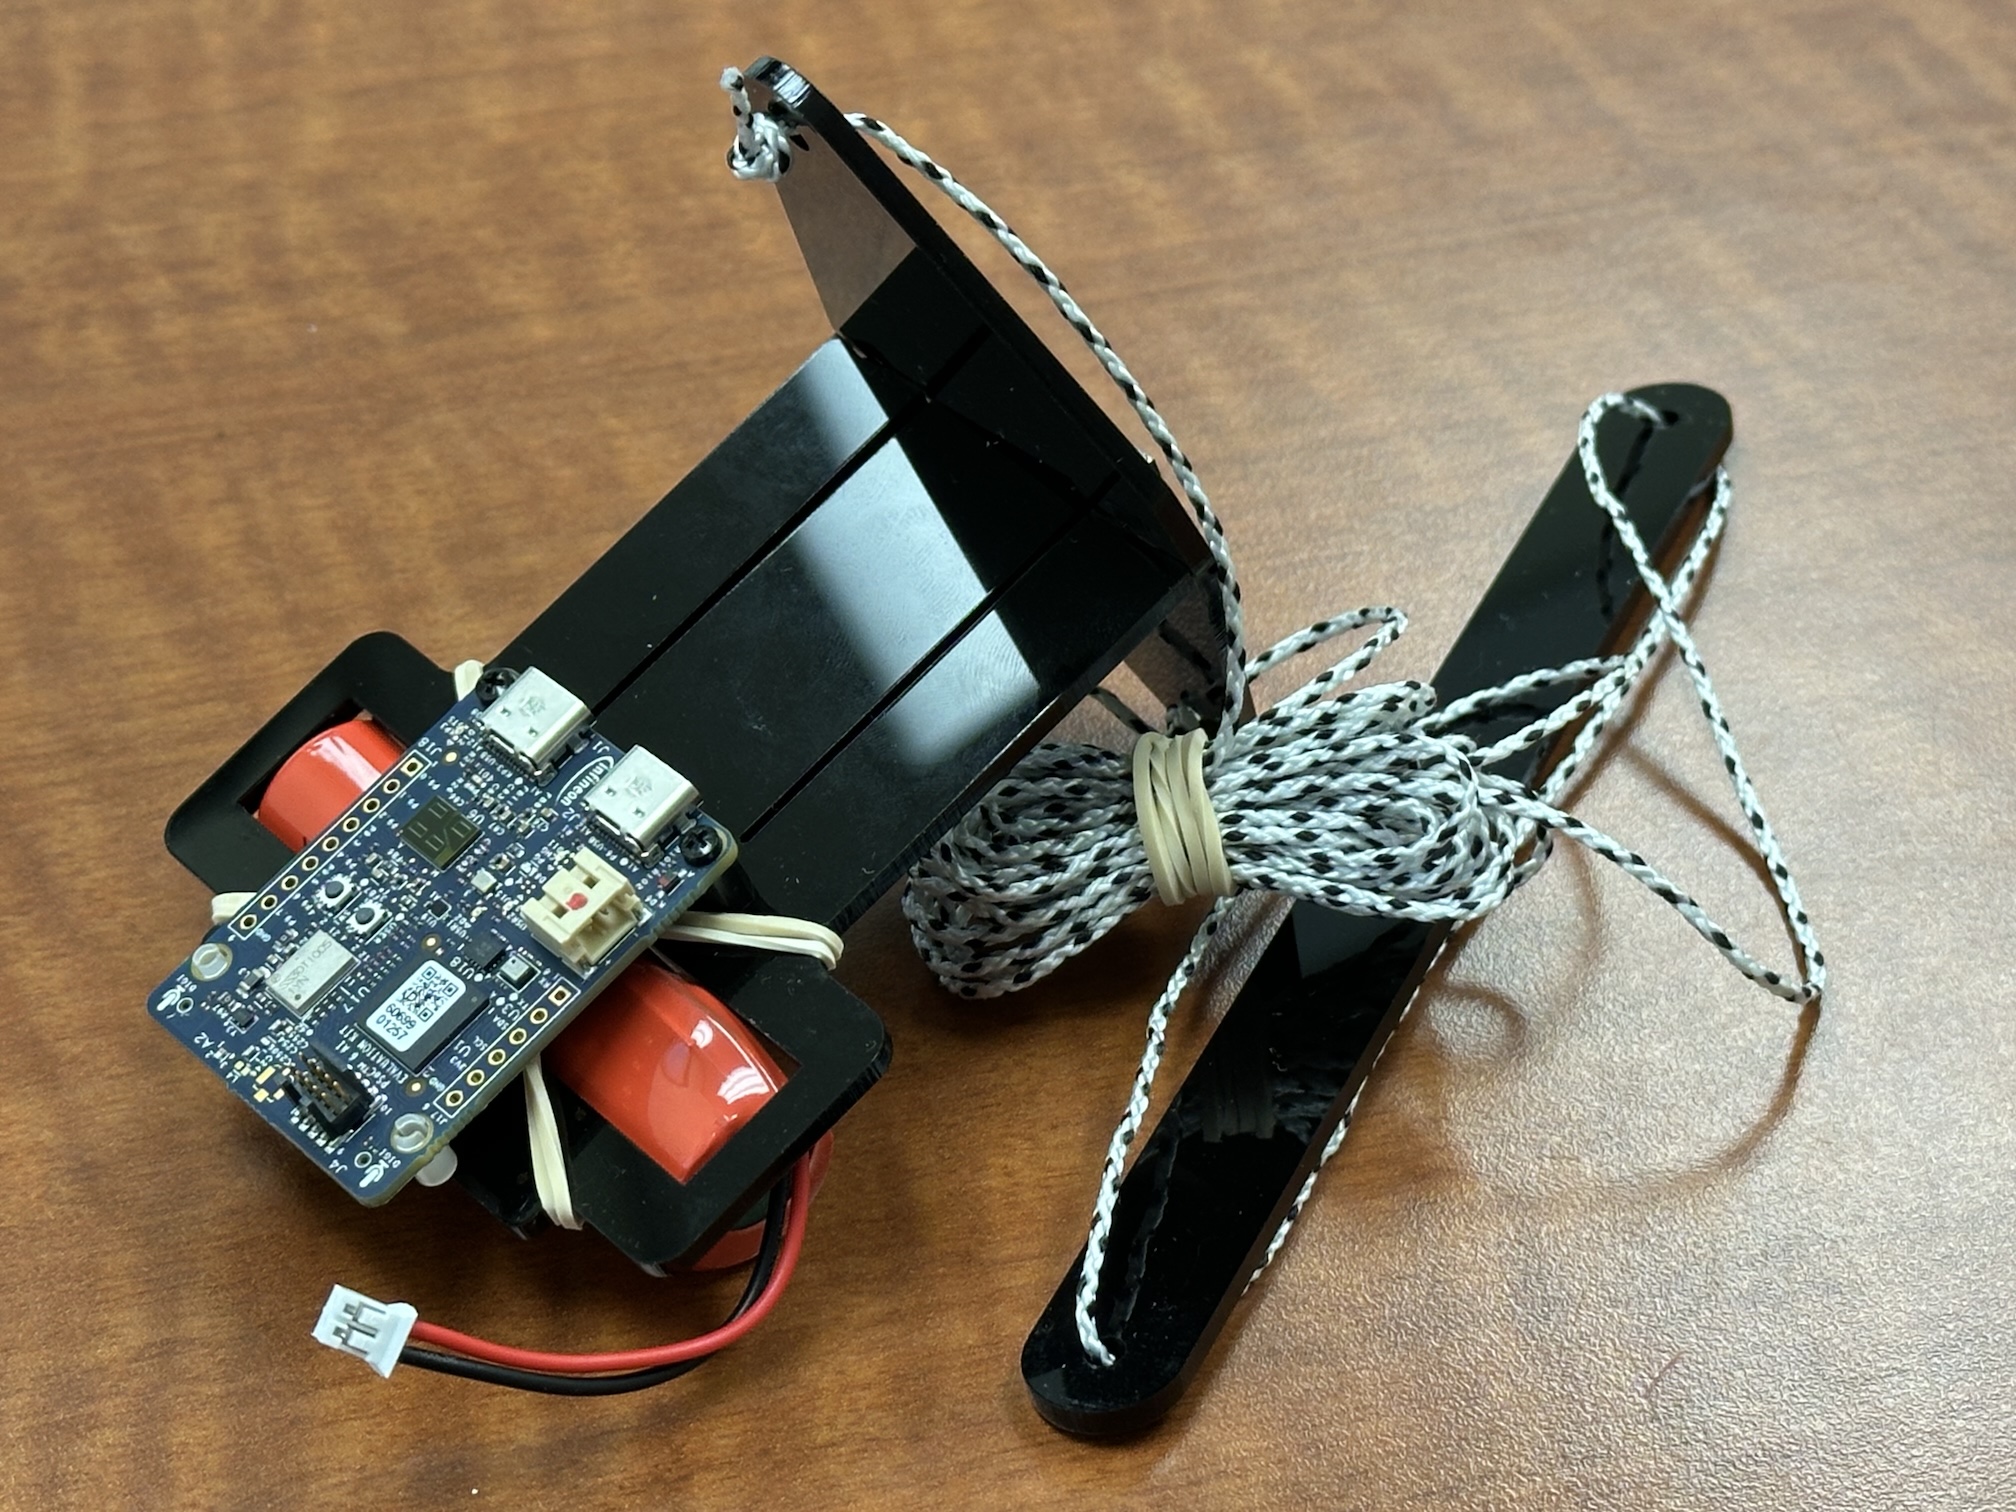
Make a note of your bag’s number.
The battery cable should be disconnected now. You will connect it later to start the program running on the PSoC6. There is no on/off switch, just like with your PicoW modules.
Drawings for the laser-cut plastic parts are here

PSoC6 Evaluation Kit Overview
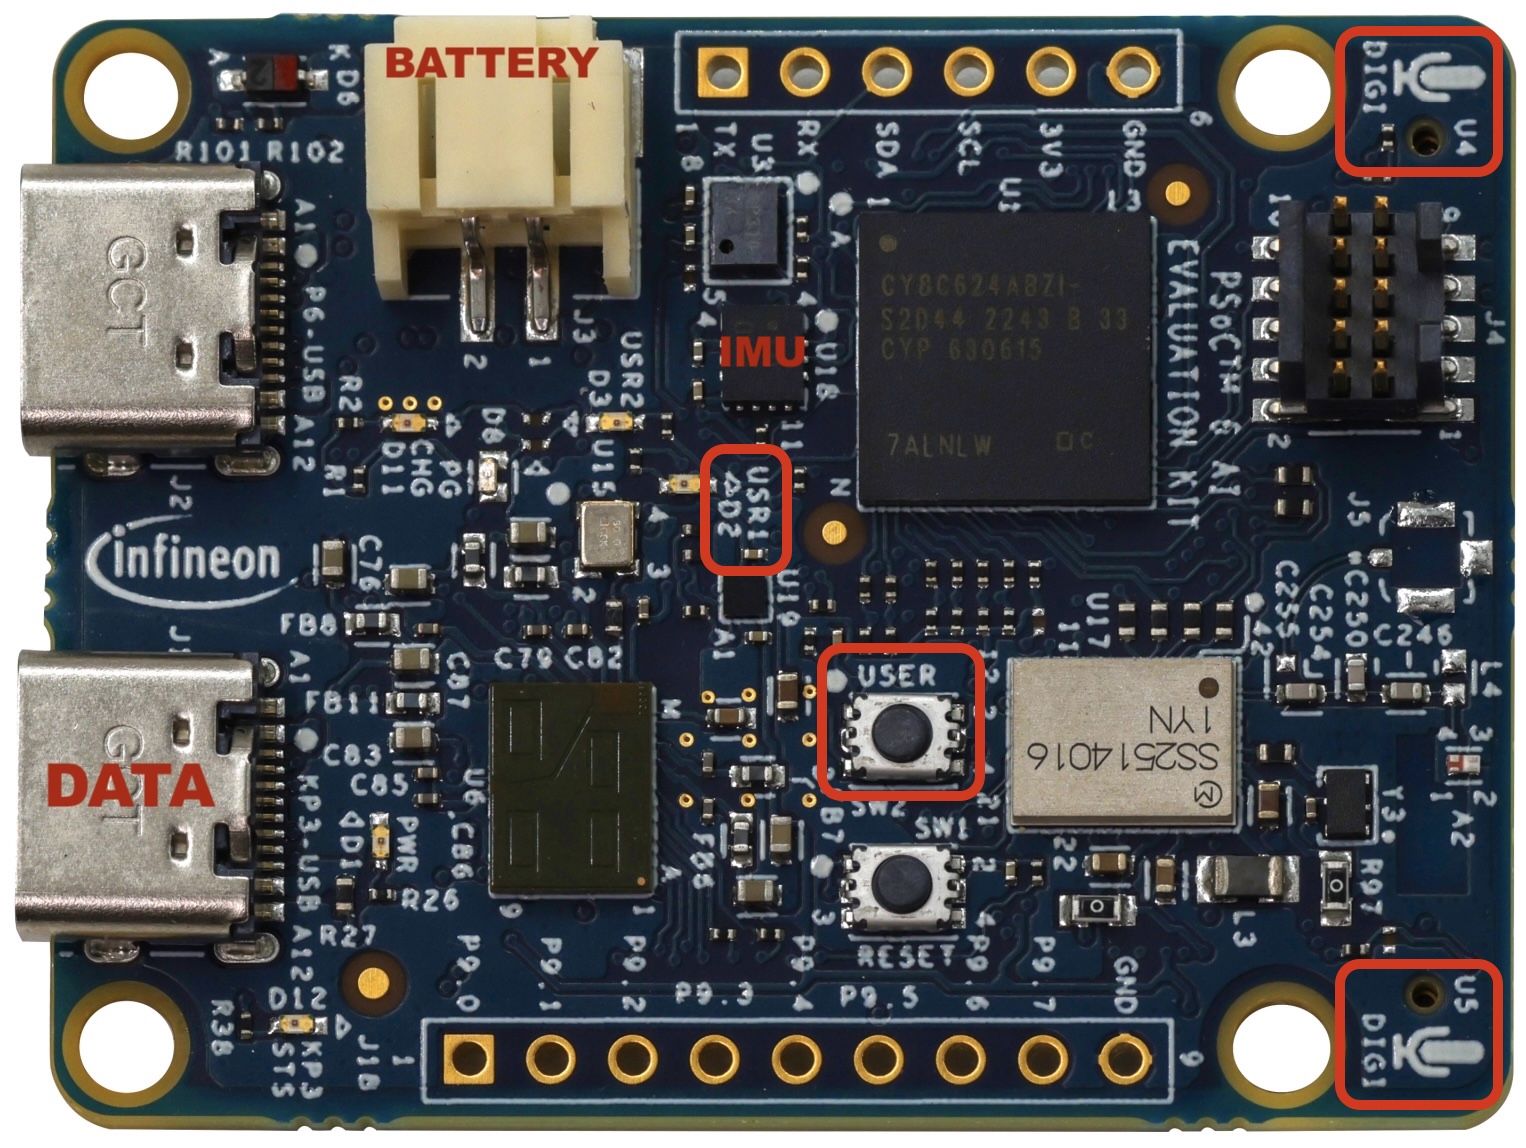
These evaluation kits were kindly donated by infineon technologies.
The program source code is written in C and available on github. The code monitors the USER button, controls the USR1 red LED, reads out the IMU accelerometer and one of the microphones, and dumps data to one of the USB ports.
Build PicoW Circuit
- Build and program a circuit using a PicoW, speaker and DPS310 (pressure & altitude) module to:
- output 2KHz sine wave
- measure air temp using Barometer I2C module
- install the phyphox app on a phone and use the Audio Scope and Frequency History tools to verify your sine wave
- if you have trouble generating a 2KHz sine wave, you can use the phyphox Tone Generator instead
Calculate Sound Speed
- Measure ambient air temperature in degC using your PicoW circuit
- Look up relative humidity (RH) online
- use this page to calculate and record the speed of sound in m/s
- Estimate the uncertainty in your calculated speed by varying the sliders and assuming a RH error of 10% and temp error of 1°C. Hint: hovering your mouse to the right edge of the temperature and RH numerical inputs reveals up/down arrows that you can use for precise adjustments.
Install Serial Terminal
- Download and install CoolTerm from here
- Click on the down arrow in the bottom-left corner of CoolTerm and select Port. Make a note of which ports are listed. Later, you will see a new port listed here that you will connect to.
Mac Security Instructions
If you are using a Mac with a recent version of the OS, you will need to tell it to trust this application following these steps:
- Try to run CoolTerm, but it will be blocked by the OS. Click “Cancel” (do not click the “Delete” option).
- Open your System Settings and navigate to “Privacy & Security”
- Scroll down to the Security section. You should see a note saying something like “CoolTerm was blocked from opening because it is not from an identified developer.”
- Click the Open Anyway button
- You will be prompted for your Mac password or Touch ID
- Try to run CoolTerm again. A final dialog will appear asking if you’re sure.
Collect Calibration Data
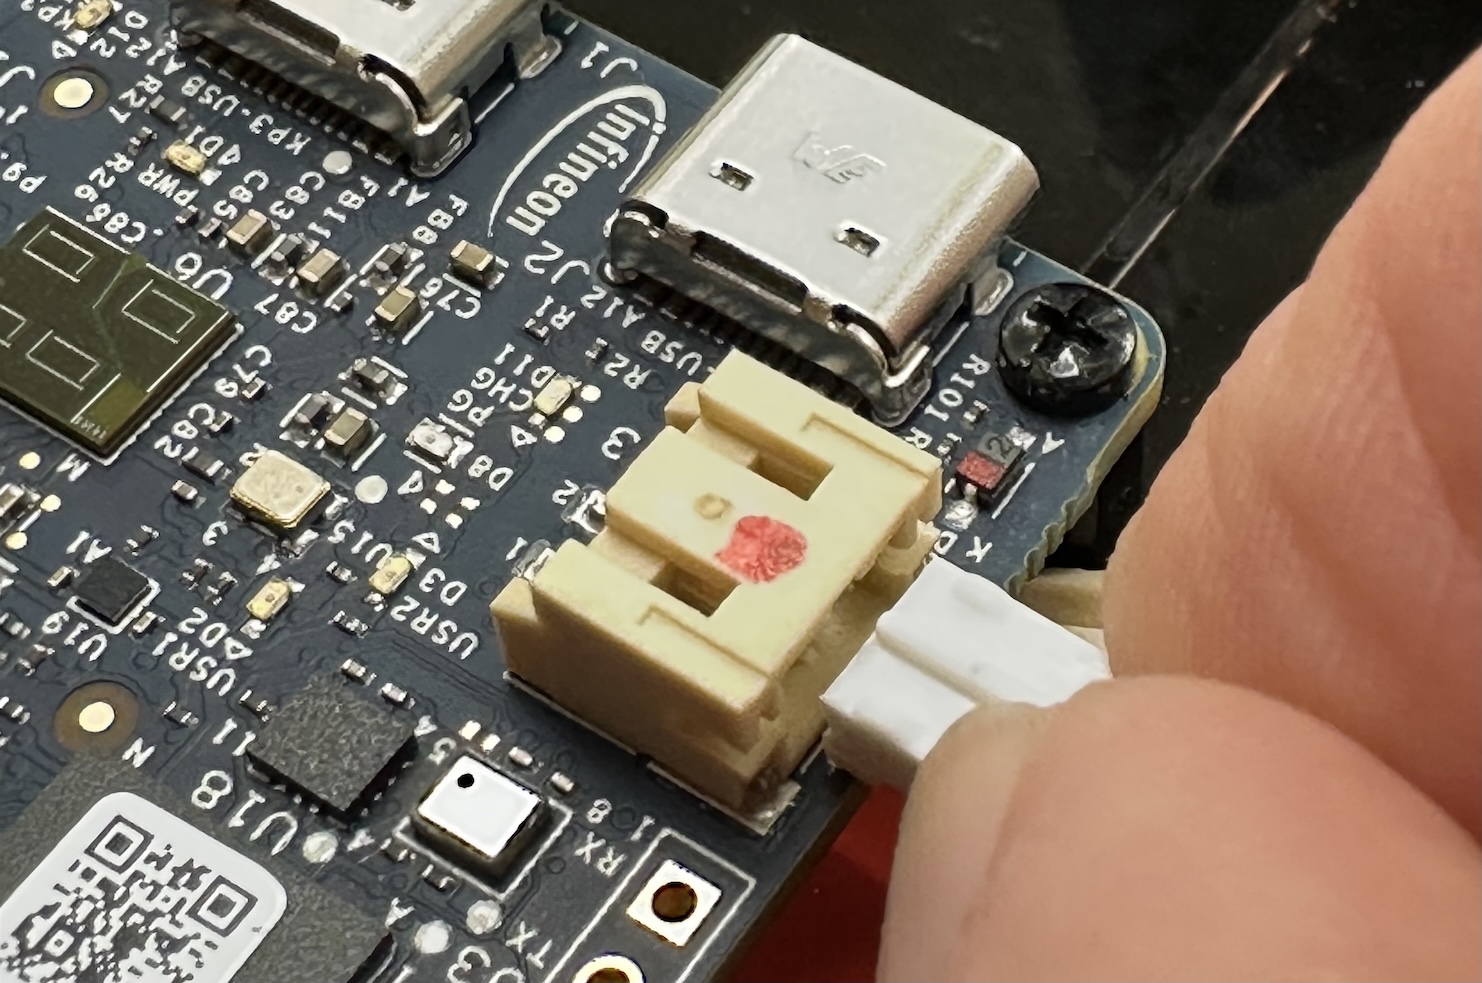
- Connect battery to PSoC6 module. Pay attention to how the connector fits and do not force it in backwards. Refer to the image below, showing the correct orientation for inserting the connector. Never pull directly on the red or black wires.
- Refer to the image above to locate the USR1 red LED and the USER button on the PSoC6 module.
- Turn on your 2KHz tone somewhere near your PSoC6 module.
- Press the USER button and leave the fixture stationary, without disturbing it. You will need to support the circuit board from below when pushing the button. Since the button is so small, it might be easier to press it down with a fingernail.
- The red USR1 LED will flash slowly for 5s then rapidly for 64s.
- The initial 5s is to let the fixture settle, then data is recorded during the 64s.
- The IMU and microphone are sampled every 128ms, which gives 500 samples over 64s.
- Turn off 2KHz tone.
- You will leave the battery connected for the rest of the class.
Download Calibration Data
- Connect a USB cable to the connector marked “DATA” in the diagram above.
- Connect the other end of the cable to the laptop where CoolTerm is installed.
- Click on the down arrow in the bottom-left corner of CoolTerm to select:
- the new port that should now appear
- a baud rate of 115200
- Click Connect
- Start capturing data to a file using the Connection > File Capture > Start… menu item. Use
idle.csvfor your filename. - Type
din the terminal window. You should see many lines of numbers fly by, which are being captured to your CSV file. - Close the file using the Connection > File Capture > Stop menu item.
Analyze the Calibration Data
- Load this page.
- Click “Choose File” to load your
idle.csvfile. - Adjust the start/stop sliders, if needed, to trim data at either end where the module was not stable.
- Study the histograms, which show:
- The magnitude of the measured acceleration vector in units of g=981 cm/s^2, which should peak near one.
- The observed frequency of each 128ms chunk of recorded audio data, obtained using a fast Fourier transform, which should peak near your tone generator frequency.
- Both of your histograms should be Gaussian shaped and quite narrow. If not, you may need to repeat your experiment, making sure that that your module is not disturbed during the recording period and that your tone generator is on and sufficiently loud.
- Calculate the relative accuracy of the acceleration and frequency measurements in percent.
- Save a screenshot of the two histogram plots.
Collect Pendulum Data
- Remove the rubber band around the string and practice swinging the pendulum with the upper piece held a fixed distance above the floor. Aim for only a small gap (10-20cm) between the bottom of the pendulum arc and the floor. Refer to the photo below to see how the pendulum is supposed to hang. The swing plane is perpendicular to the plane of the photo. Note how the pair of strings encourages the pendulum to swing in a defined plane, with minimal twisting.
- Estimate the distance from the pivot point to the microphones, i.e. the length of your pendulum.
- Mark a point on the floor that your pivot will be hand held above. Mark a distance about 60cm away, which is where you will launch the pendulum from. It is not necessary to measure this distance precisely.
- Mark a distance of about 40cm away from the pivot, towards the 60cm mark. Place your tone generator at this point (but leave it quiet for now). It is not necessary to measure this distance precisely.
- The procedure to start collecting data with the USER button is the same as before, but you also have the option to press the USER button a second time to stop collecting data before it stops automatically after 64s.
- One person holds the pivot point as steady as possible.
- The other person holds the PSoC6 module and battery assembly out at an angle, ready to press the button then launch. You should launch from the same side as your tone generator, and starting a bit beyond it. Remember that data collection does not start for 5s after you press the button.
- Let the pendulum swing for up to 64s, as long as it is still in motion, following a nice arc in its original plane.
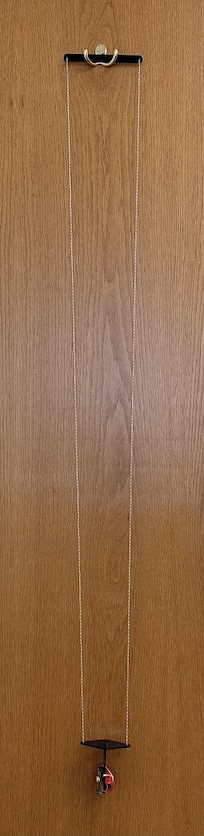
Download Pendulum Data
- Download following the same instructions as above, but using “swing.csv” for your filename.
Analyze Pendulum Data
- Load this page
- Adjust each of the 4 sliders on the top of the page and observe how they change the predicted theory curves. Your data will be superimposed on these curves and you will be adjusting the theory to match your data.
- Re-enter the air temperature and RH you obtain earlier to set the sound speed to use for your analysis.
- Click “Choose File” near the bottom of this page to load your
swing.csvfile. - Adjust the start/stop sliders, if needed, to trim data at either end where the module was not swinging freely.
- Fine tune the start slider so that the data starts at the lowest point of a cycle.
- Study the plots where your data is superimposed on the theoretical predictions for the IMU acceleration along the module’s x axis (aligned with the pendulum string) and the Doppler shift of the observed frequency.
- Next, you will adjust the model inputs to get the best possible agreement with your data.
- Starting with the IMU-x plot:
- Adjust the String Length slider to match the number of cycles between theory and experiment. Do not worry about differences in amplitude at this point. Check that the length value in cm make sense for your physical setup. You may need to fine tune your start slider to match the phase of the data to the theory.
- Adjust the Initial Offset slider to match the amplitude at the left-hand side. Check that the offset value in cm makes sense for your physical setup.
- Adjust the Damping Coef slider to match the amplitude at the right-hand side.
- Now focus on the Doppler Shift plot:
- Adjust the Source Offset and Height sliders to match the observed Doppler shift.
- Save a screen shot of the two plots.
Cleanup
- Remove the battery cable from the PSoC6 connector by pinching the connector and gently pulling it out. Do not pull directly on the red or black wires!
- Roll up the string and secure with the original rubber band.
- Put all contents back in the bag.
- Turn in the bag.